Real Estate Cycle Charts – the Basics
Charts showing the annual appreciation or decline in real estate values over time are visual snapshots of Supply & Demand forces in action. Technical Analysis (TA) relies on these charts because they accurately reflect what ACTUALLY happened.
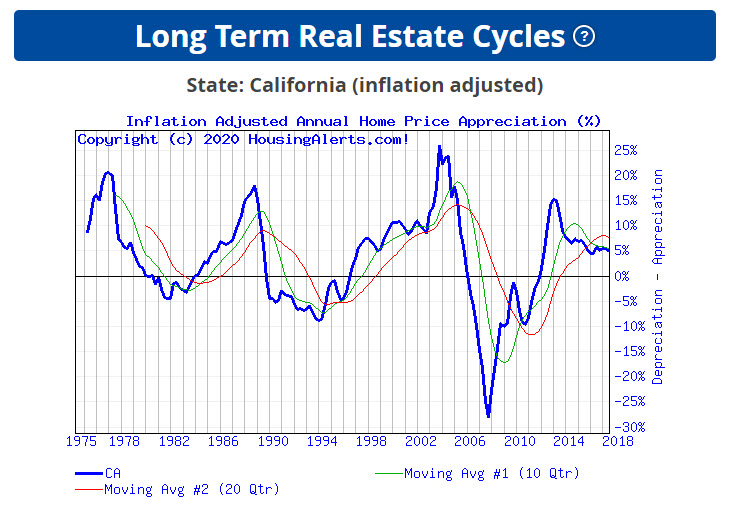
ANY and ALL Fundamental factors that can and did influence real estate values in THAT market, for THAT time period are ALREADY reflected in the chart. Other Fundamental factors that did not influence prices in THAT market for THAT time period are, by definition, excluded.
The practice of TA consists of what are called "Studies" – different sets of calculations and algorithms proven over time. These Studies include Market Psychology, the most powerful driver of all.
Because real estate is so cyclical (compared to the Stock Market, for example), relatively simple Studies can be used to accurately track local markets.
Using these charts and Studies, HousingAlerts.com deciphers the data into two broad categories:
- Market Momentum (Six Trigger Alert Report - 'STAR')
- Technical Analysis Point Score ('TAPS')
Please visit the free Video Training section for more in-depth education.
Grab your FREE State Account right now! Click here to start