Changing Chart Line Color
QUESTION:
I am red/green color blind and have found that I'm having problems differentiating on the market charts. Is there a way to make the colors more vivid or add some type of another indicator in the settings?
ANSWER:
Is the problem most acute when looking at the charts and trying to differentiate between the thin red/green Moving Average (MA) lines or does it also cause a problem seeing the round red/yellow/green STAR icons?
The first level of workaround is to say that the STAR tool 'search' automatically ranks results based on the strongest TA score – for any given set of indicator light/color/icon filter (or you can make all search icons white' to search all markets) – the results are ranked according to their TA score (the 'slider' bars).
In other words, the idea behind the Slider Bar/Score is to 'interpret' the charts FOR you and reduce/eliminate the need to become an expert chart reader or TA interpreter.
So a second level solution is to use the Custom Analysis tool to drill down deeper on good prospect markets where you can ALSO recreate any charts we have (and a whole lot more) and make any chart line any color, thickness or format (like dashed) you want.
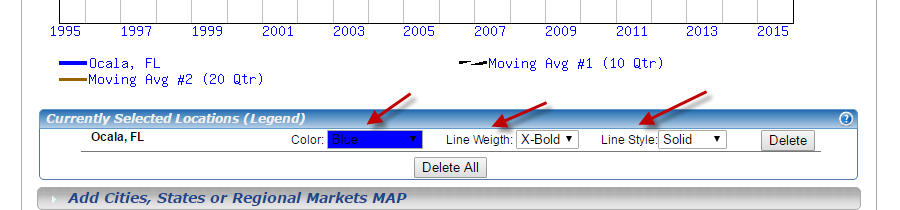
1) To analyze any SINGLE market, first select your market using the map or the "Search for MSA" feature at the top. You can customize that line color, style, etc using the legend directly under the map. (Click on the color to change it.)
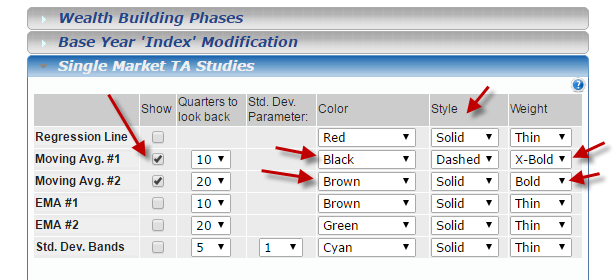
2) Then open the "Single Market TA Studies" tab near the bottom. Check which indicators you want to see – and select color, style or line weight.
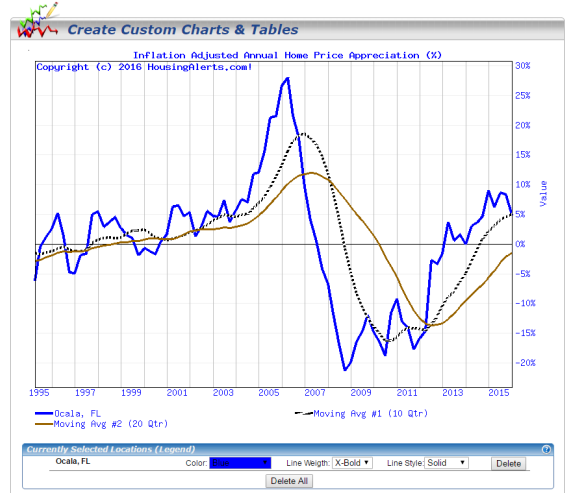
This is one sample of the kind of chart you can produce:
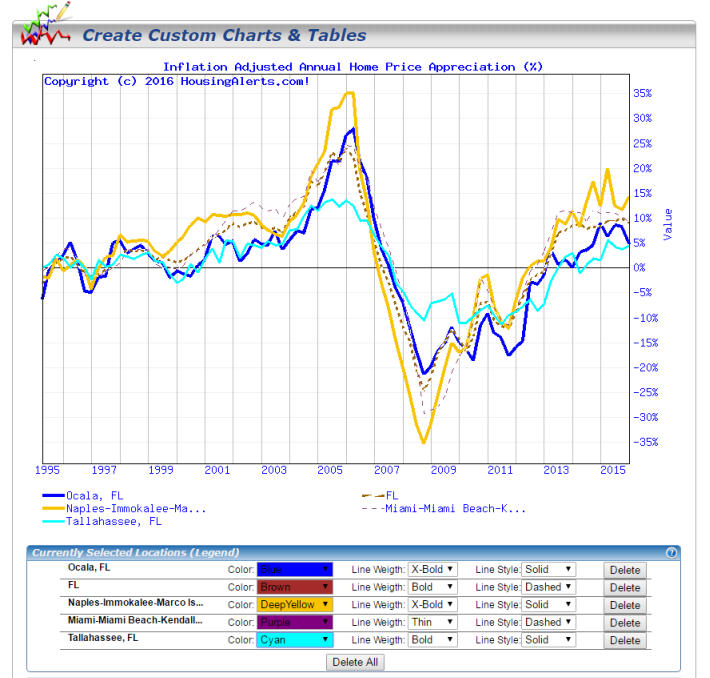
You can do similar custom line configurations for multiple markets in one chart. Here's an example: