When Maps Do NOT Align
Question:
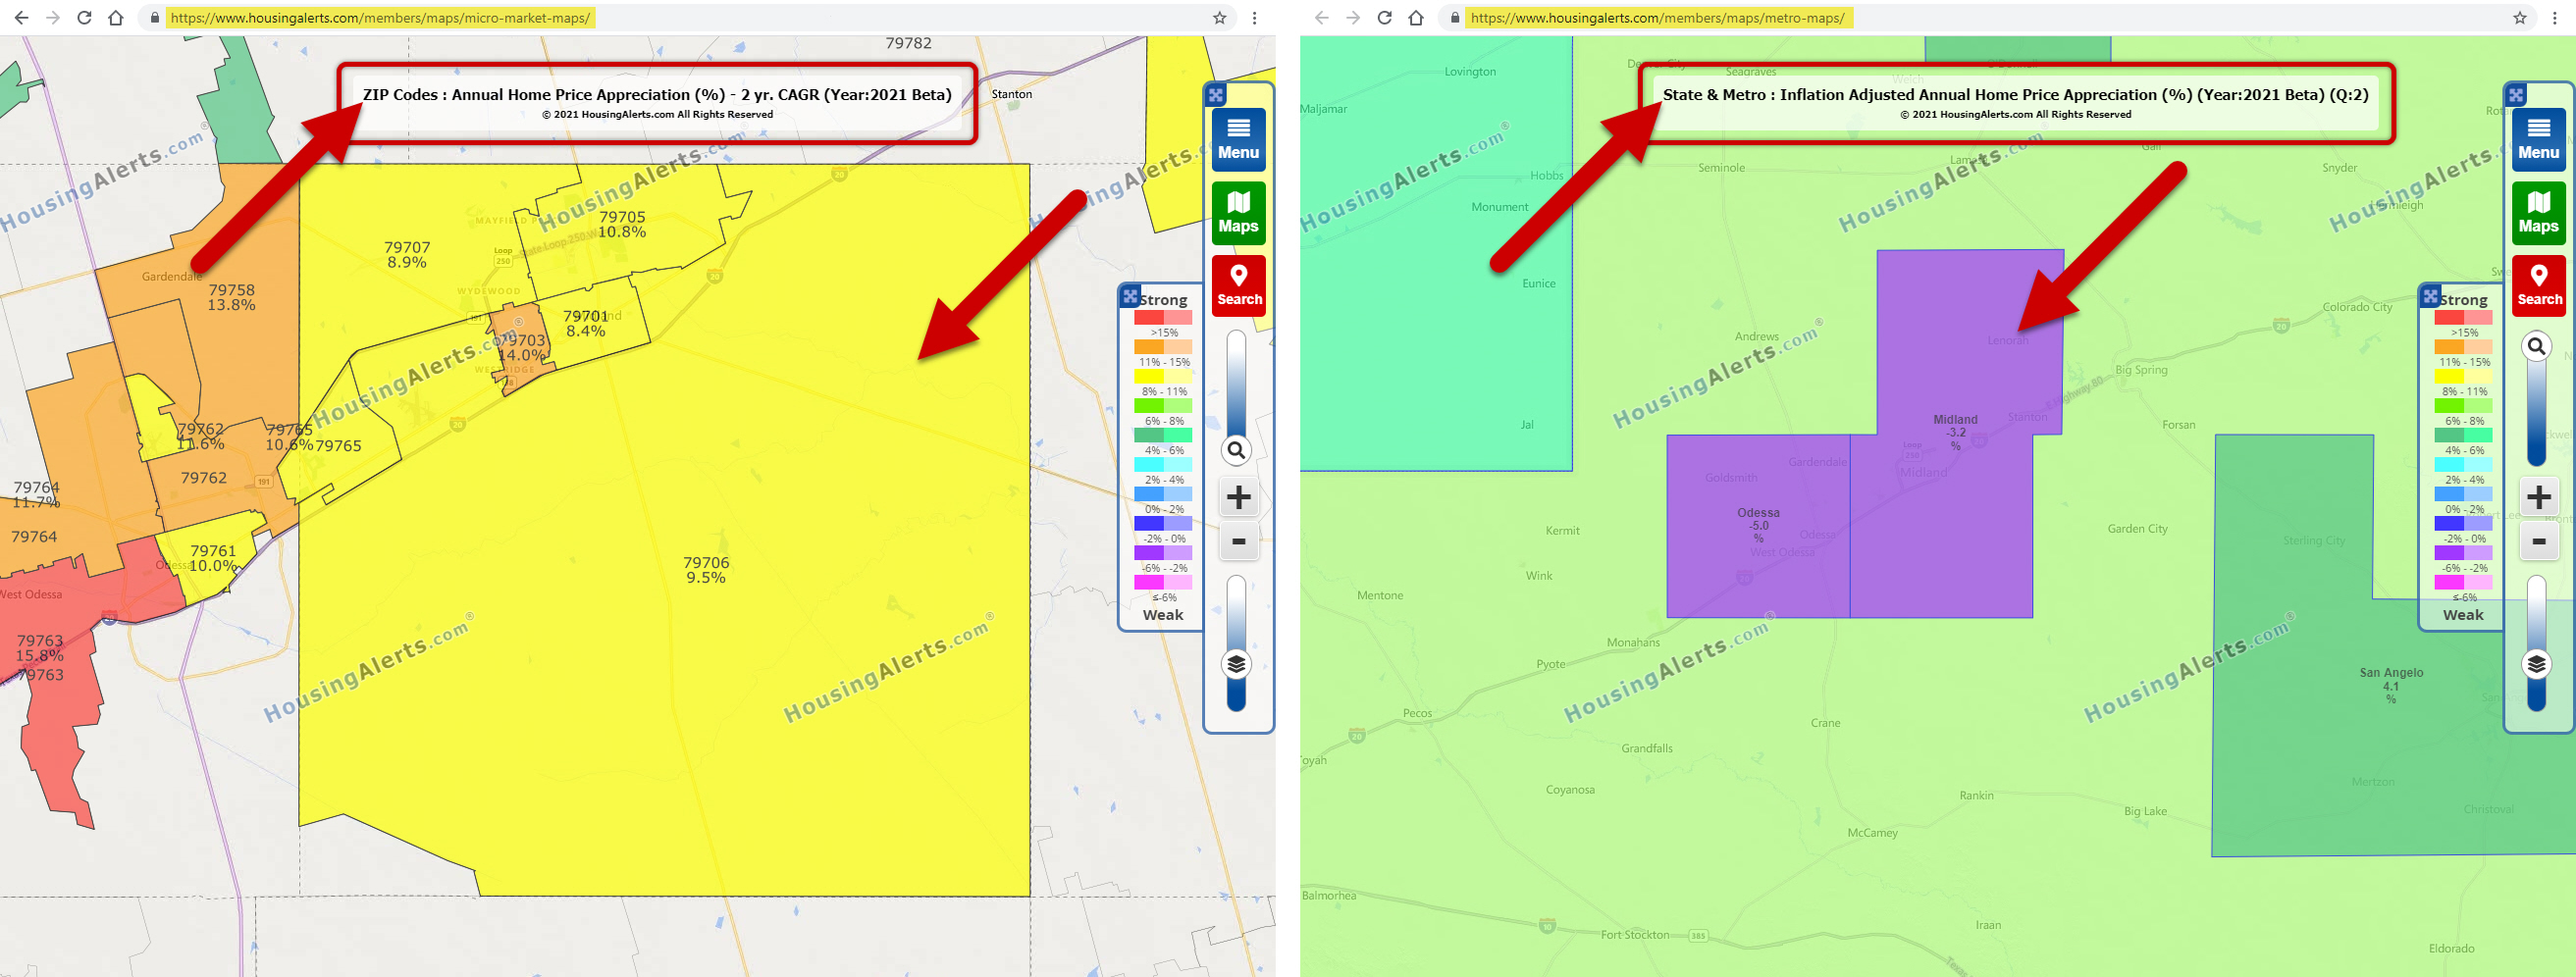
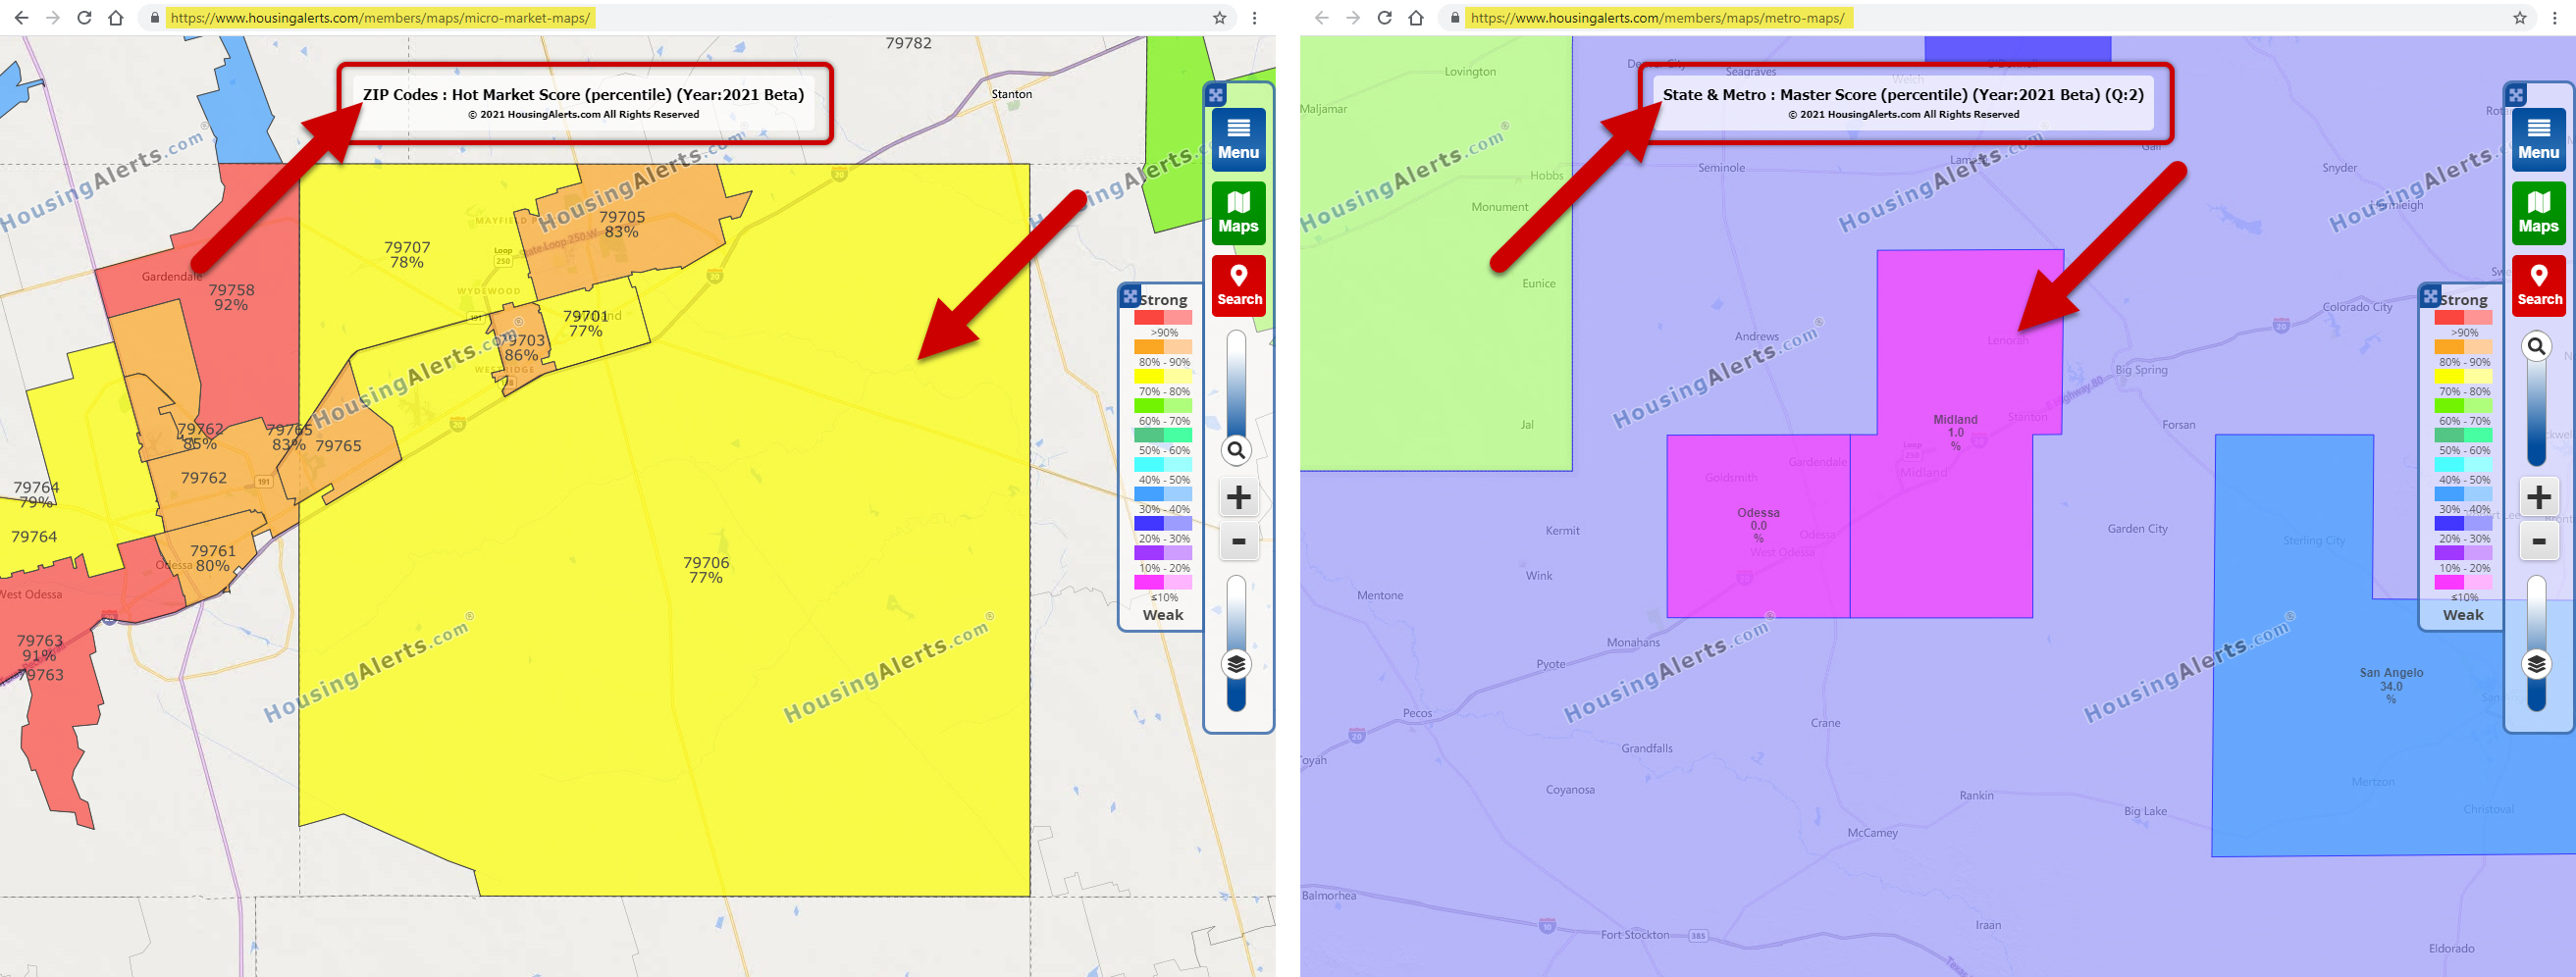
Why don’t the Micro and Metro Maps and indicators always look the “same” for the same market?
Answer:
The most common explanation is because the maps may not be using the same indicator.
For example, Micro Maps load the "Annual Home Price Appreciation ("AHPA") – 2 yr CAGR" indicator by default, whereas Metro Maps load the "Inflation Adjusted AHPA" by default.

Another reason is some indicators, like the Hot Market Score in Micro Maps is NOT the same as the Master Score in Metro Maps as explained below…

Micro Market indicators and scores are compiled and calculated using different data and algorithms.
Because micro markets are, by definition, much smaller than Metro markets, there are far fewer real estate transactions and therefore much smaller sample sizes for any given time period.
The result is that Micro Market indicators and scores require longer time periods to develop. Micro Market results are 'delayed' relative to the Metro Market tools and indicators.
This is especially apparent when the metro markets experience massive, untypical upward or downward price movements, such as the big surge in home prices during the 2nd quarter of 2021. It takes more time for those metro level price "shocks" to have a big impact on the micro level data collection.
