S.T.A.R. & T.A.P.S. Indicators
S.T.A.R. Momentum Indicators and T.A.P.S. Indicators
The S.T.A.R. & T.A.P.S. Indicators are located in the Summary Market Scoring Report (All levels) and the Six Trigger Alert Report (PRO level).
The below information discusses the basics of the S.T.A.R. & T.A.P.S. Indicators. To understand and use these tools, please watch this video, or its "pdf" version: S.T.A.R. & T.A.P.S. Indicators - tutorial (pdf)
S.T.A.R. Indicators - the basics
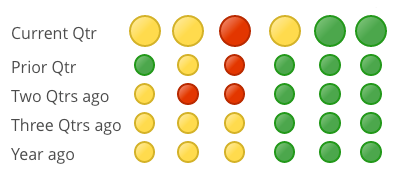
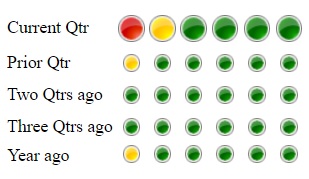
The STAR ( Six Trigger Alert Report) momentum indicators show the ‘energy’ behind any market. For a sustained up-cycle, it MUST be supported by momentum. Market Psychology influences momentum, but is not the only driver.
Each of the six ‘triggers’ represent a distinct Technical Analysis (TA) ‘event.’
The left-most columns are Short-Term triggers and carry far less significance than the Long-Term indicators on the right.
However, all Trend Reversals (up or down) BEGIN with the short-term triggers. They provide early-warning signals, especially when they develop a consistent pattern of changing colors (from green to red, or red to green) ‘growing’ from left to right.
Green means positive, upward sloping momentum. Red means the opposite. Yellow occurs when, in the current period, the slope/direction changed for that trigger.
Markets that do not display a consistent one-color pattern; with seemingly random (horizontal) color changes from one period to the next, especially in the long-term triggers, are generally lacking ANY momentum, and are poor investment markets for Leveraged Appreciation.
Please visit the free Video Training section for more in-depth education.
To analyze specific cities you should use the Summary Market Scoring Report. However, if you want to see where a specific city falls in the STAR ranking results, please do the following (log in to your dashboard, and click Six Trigger Alert Report toward the bottom of the dashboard):
T.A.P.S. Indicators - the basics
The TAPS (Technical Analysis Point Score) indicator is an easy to understand, graphical way to show the results of complex Technical Analysis (TA) ‘ Studies.’
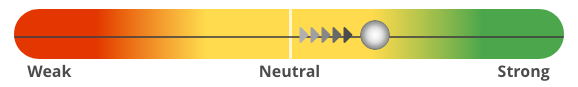

The simple ‘ slider ball’ can move a total of five notches starting from far left (Weak) to far right (Strong), which indicates the strength of the market.
If the ball position has moved since the prior period, it will have a series of arrows behind it. If the arrows are on the left, that signifies a move from the left, from a weaker to a stronger position, and vice-versa.
Each detailed TA Study has its own slider ball indicator and consists of dozens to hundreds of individual calculations (collectively referred to as ‘algorithms’).
These detailed algorithms are aggregated and weighted to produce higher level Summary slider indicators until the top-level, overall score is attained.
These proprietary TAPS scores are then ranked and compared to other markets to optimize the member’s opportunity cost and investment success.
Using complex, proprietary and back-tested calculations these TAPS scores are then merged into the Momentum (STAR) Studies to produce the most reliable, state-of-the-art and proven local real estate market cycle system on the planet!
Please visit the free Video Training section for more in-depth education.