Hot Market Finder - User Guide
You can now pinpoint and rank EVERY real estate market in your subscription, using multiple, proven and back-tested indicators. The Hot Marker Finder is one of our most powerful tools within HousingAlerts.
Locating the Hot Market Finder tool
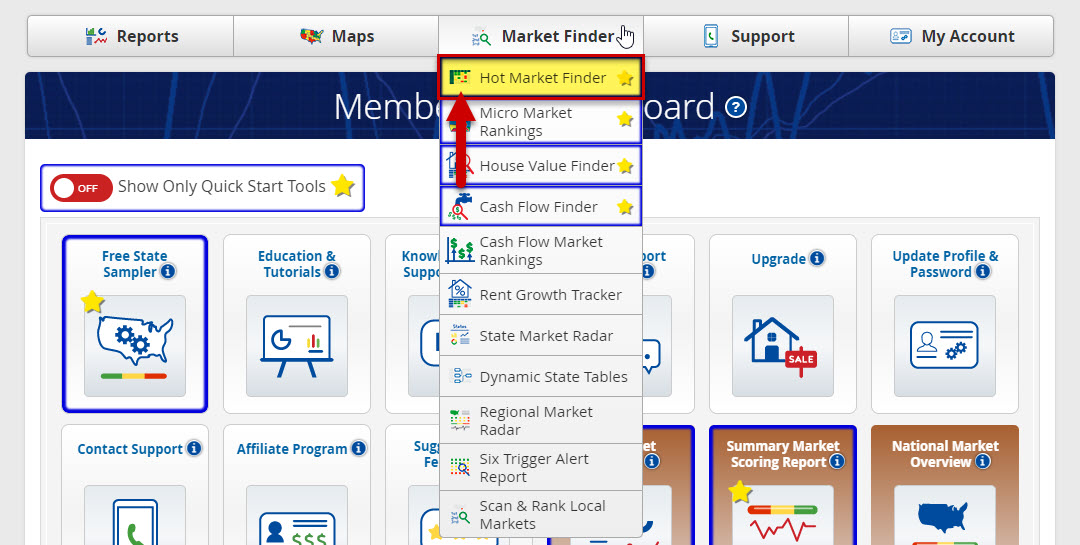
To find the Hot Market Finder, simply click on the Market Finder tab on the menu bar, and select Hot Market Finder from the drop-down list.
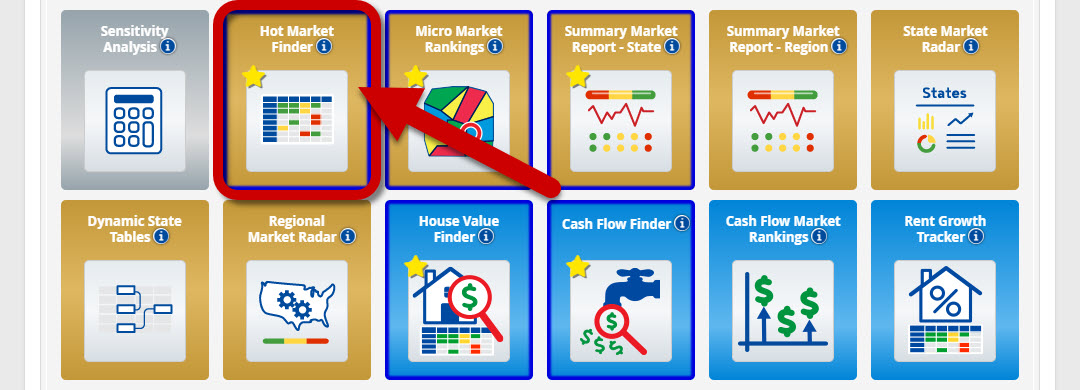
Or, you can locate it in the Dashboard (Gold section).
Using the Hot Market Finder
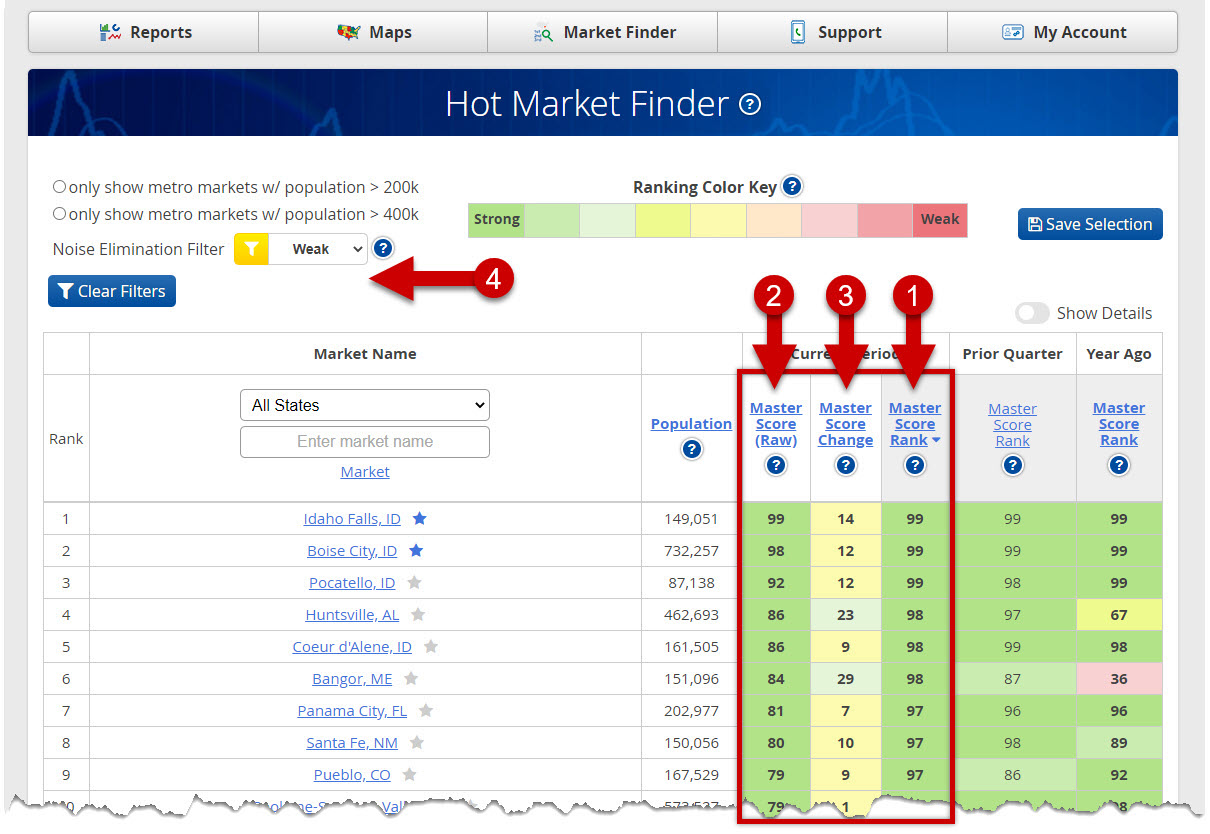
Once you have accessed the Hot Market Finder tool you will see the "Master Score" data columns, as shown below. BUT there is a lot more to unpack ...
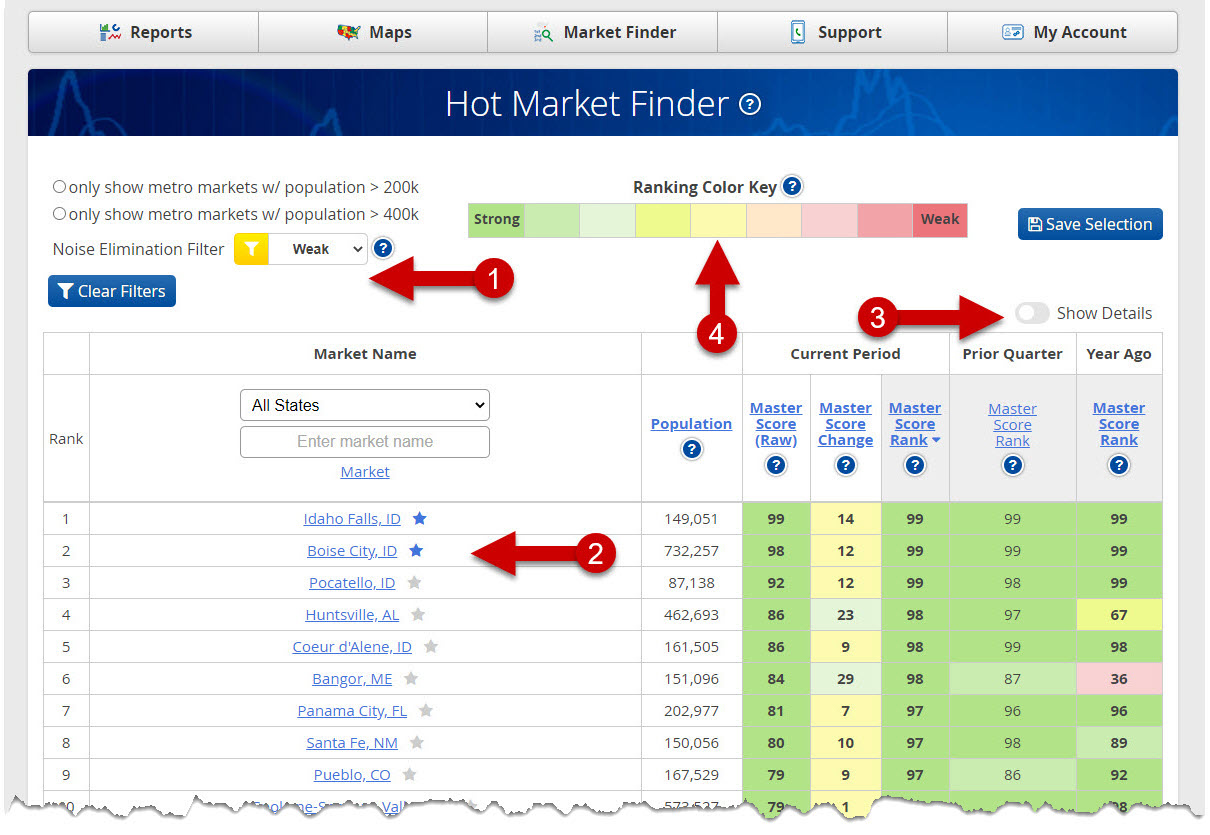
- Filter your results by population size and strength of the "Noise Elimination Filter".
- Click any market to view the local market summary. You can also save the market to your "My Market Tracker" by clicking the "Star" icon.
- Click "Show Details" to reveal all the other data columns offered.
- Ranking Color Key - The numbers in each cell represent the percentile (rank) and raw score of each market RELATIVE TO ALL MARKETS. A score of "95" means that, for this indicator, 95% of ALL markets scored lower. In the Ranking Color Key, green indicates a strong market with 99% being the best score, and red indicates a weak market.
Once you click "Show Details", all columns will be revealed and run the table the full-width of your browser/screen for easier review.
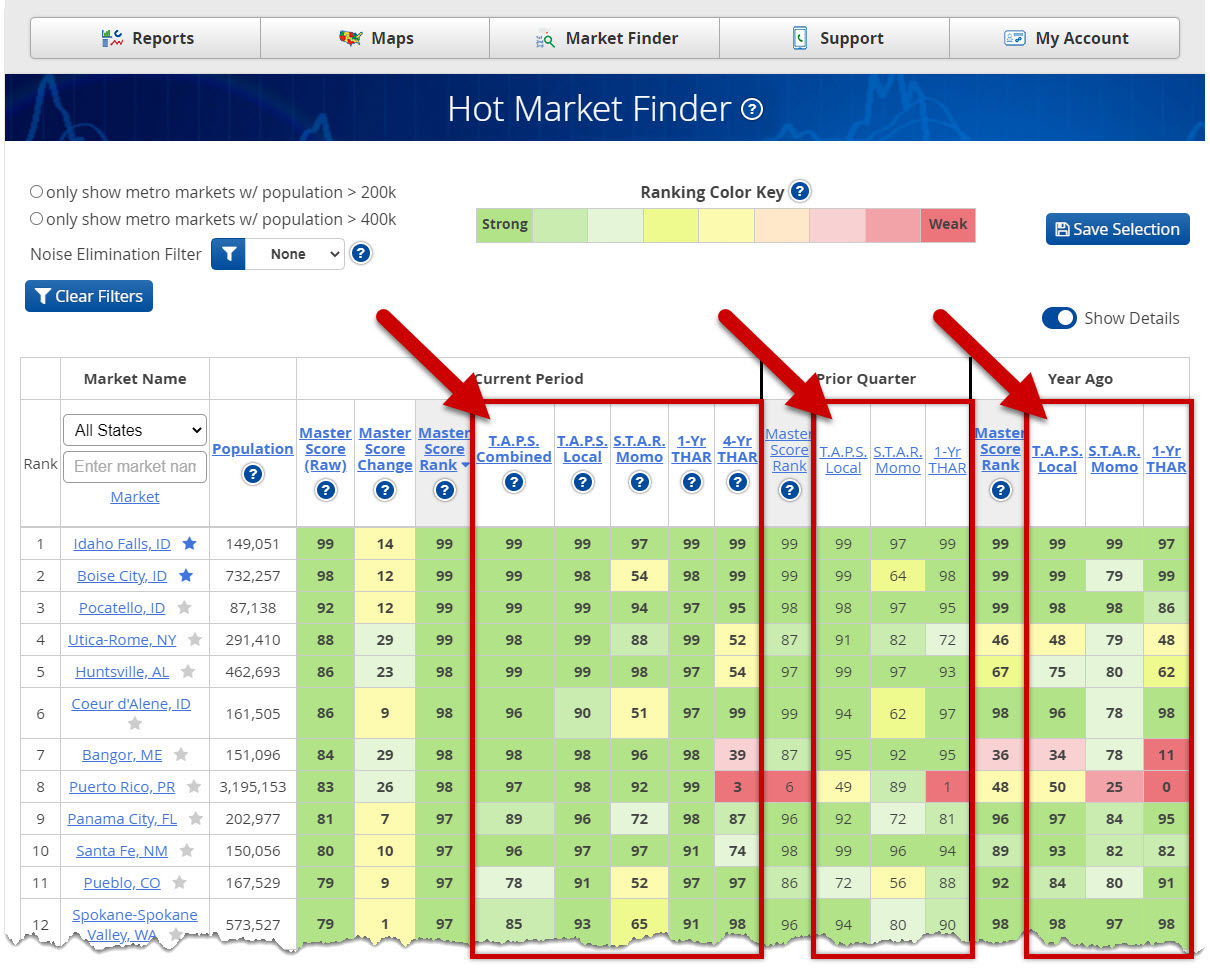
This is recommended for more advanced users to give a more thorough examination of your markets.
These additional columns allow you to evaluate and compare several other indicators for all of your markets.
Using Master Scores & Noise Elimination Filter
-
These are the strongest markets shown with our "Master Score Rank". The "Master Score" is the best single indicator (if you only want to look at ONE scoring element). The "Master Score" is a proprietary algorithm that integrates all data into a single score.
The data shown is the Percentile Ranking for each market's Master Score, RELATIVE to all similar markets. Note that percentile rankings are useful for measuring RELATIVE performance BETWEEN markets, not for measuring the absolute performance. Use these percentile scores in conjunction with the TAPS, STAR and Wealth Phase indicators.
-
The "Master Score (Raw)" is a proprietary algorithm combining the TAPS, STAR and other indicators into a single score. This is the best single indicator (if you only want to look at ONE scoring element).
The “Master Score” is a proprietary algorithm that integrates all data into a single score. The data below is the Percentile Ranking for each market's Master Score, RELATIVE to all similar markets.
-
The "Master Score Change" indicator can be used to identify possible early stage emerging (or falling) markets.
The number represents the increase or decrease in that market's raw Master Score from the prior year.
In the Hot Market Finder, unlike the other columns to the right which convert raw scores into "percentile rankings" this column uses the 'raw score' which makes it easier to gauge the magnitude of the change from the prior year.
The idea behind the 'change" column is to start flagging any "big movers", increases of more than 15 (light green) or declines of 20 or more (light red).
Changes in between this range are not particularly "newsworthy" for a "change" tool. Therefore, if the change is between +19 to -14, it will be white .... meaning it is not one of the 'extreme" movers from prior year.
The idea behind the 'change" column is to start flagging any "big movers", increases of more than 15 (light green) or declines of 20 or more (light red). Changes in between this range are not particularly "newsworthy" for a "change" tool. Therefore, if the change is between +19 to -14, it will be white .... meaning it is not one of the 'extreme" movers from prior year.
- The Master Score for smaller local markets (with fewer home sales) may have a larger variance, or what we call 'statistical noise', when compared to larger markets with more home sale transactions. Use this "NOISE FILTER" to hide those smaller real estate markets from appearing in the results below. By default, this filter is set to "WEAK" and will display all but the most 'statistically noisy' markets. Setting this filter to "NONE" will display ALL markets, including those with a lot of 'statistical noise' arising from small sample sizes and/or high variance. Setting this filter to "STRONG" will display only those markets with the most reliable data (generally the larger population markets).
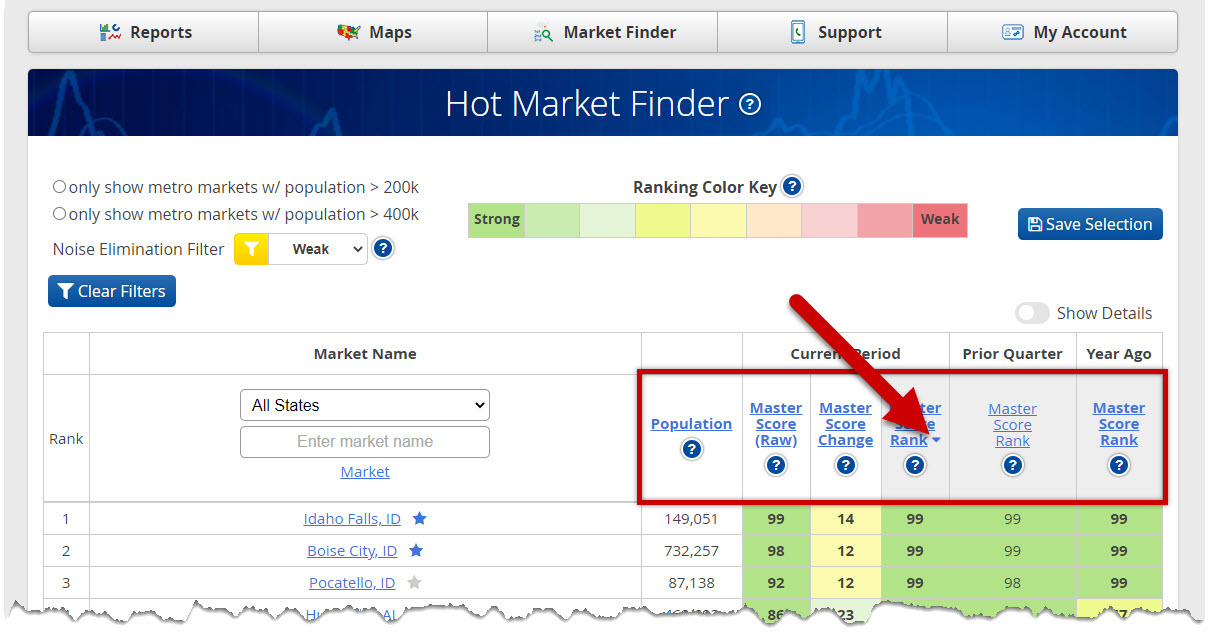
Also, clicking on the Column Titles in the Hot Market Finder shows where your market ranks in relation to all markets based on each scoring element (located at top of each column). You will see a "▴/▾" to note the column in use and to show if it is highest to lowest(▾) or reverse order(▴) sorting.
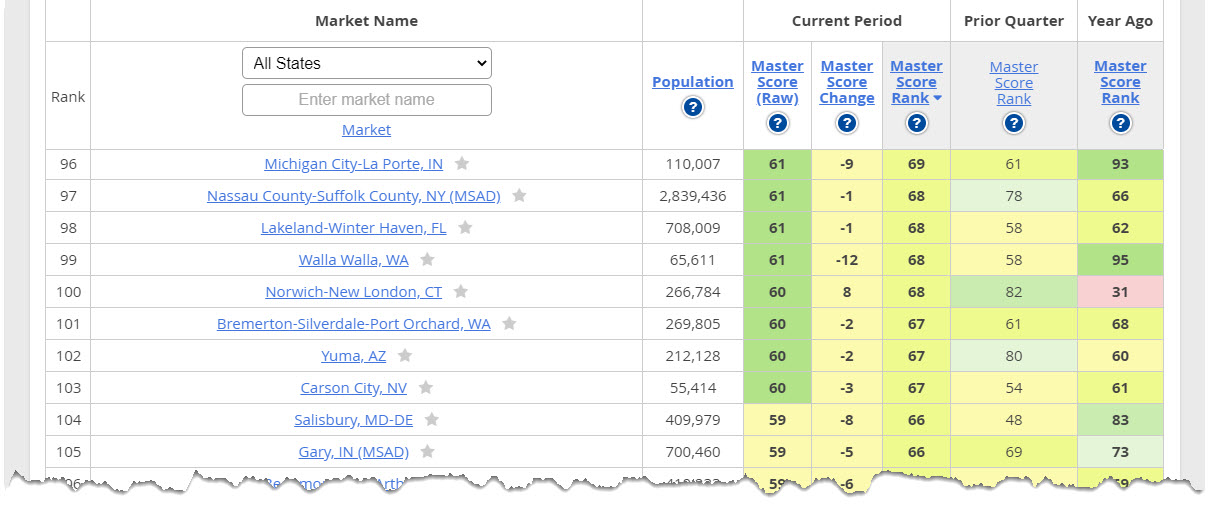
Here's the middle of the pack in the "same" Hot Market Finder. The changing colors (from right to left) also help find very early stage emerging and crashing markets…
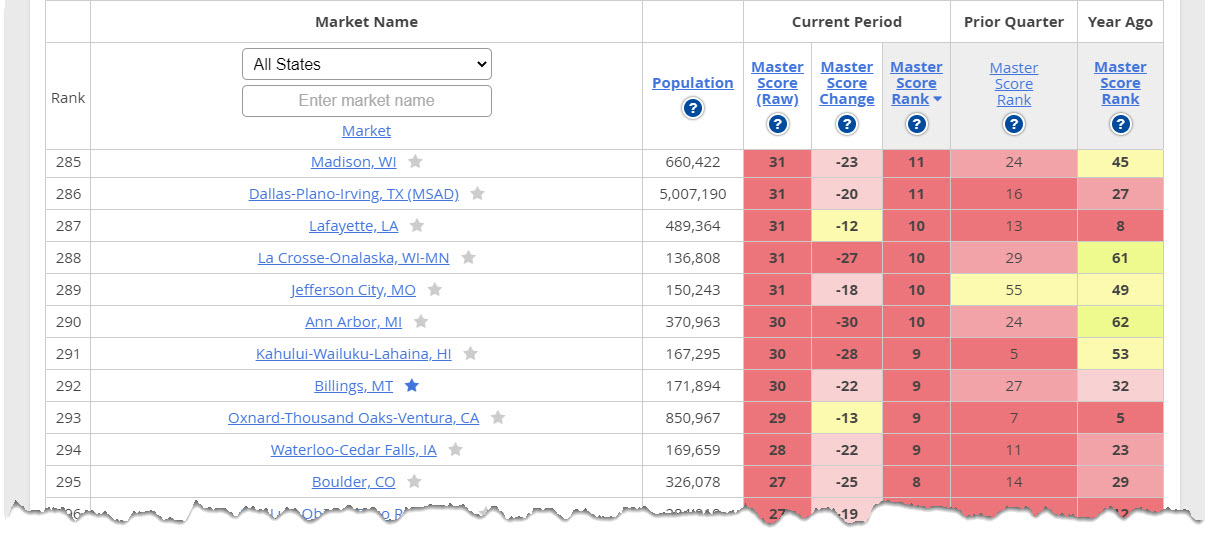
Here's the bottom of our Hot Market Finder, the declining and crashing markets… the ones you should avoid.
Once you've identified a market for your watch list, you'll want to drill down further to learn the momentum, strength of the market and wealth phase of the market using the Summary Market Scoring Report.
To do this, click on the name of the market in the Hot Market Finder. It will redirect you to the Summary Market Scoring Report (For detailed information, please refer to the Summary Market Scoring Report training doc).
To learn more about the Hot Market Finder, please click this link.