Micro Market Ranking Tools - User Guide
One of our best tools for Flippers, Wholesalers and Landlords is the Micro Market Rankings! Learn how to target the best counties, zip codes and NEIGHBORHOODS in just a few clicks!
Locating the Micro Market Rankings tool
To find the Micro Market Rankings, simply click on the Market Finder tab on the menu bar, and select Micro Market Rankings from the drop-down list.
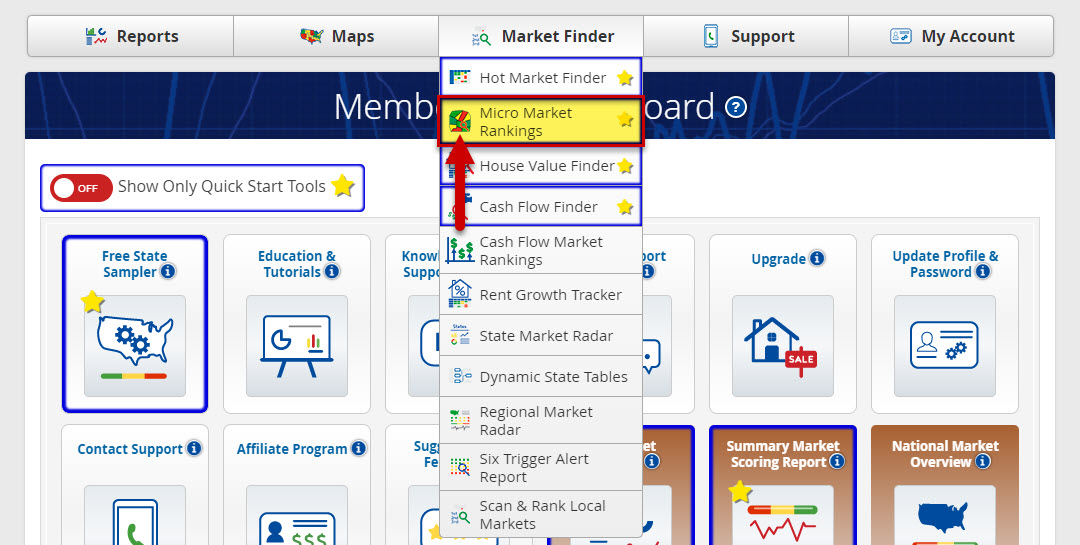
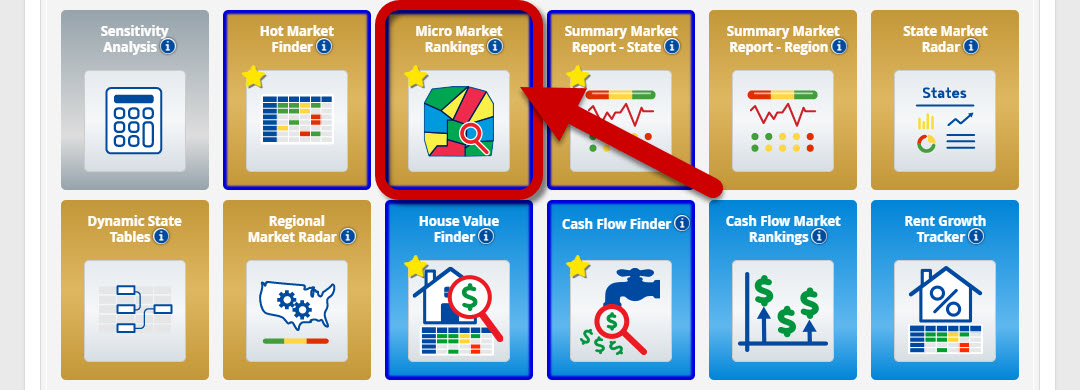
Or, you can locate it in the Dashboard (Gold section).
Using the Micro Market Rankings tool
By default, the page loads with a ranked list of ALL the county markets within all the individual Cities and States within your subscription.
(This view is for the entire U.S.A.)
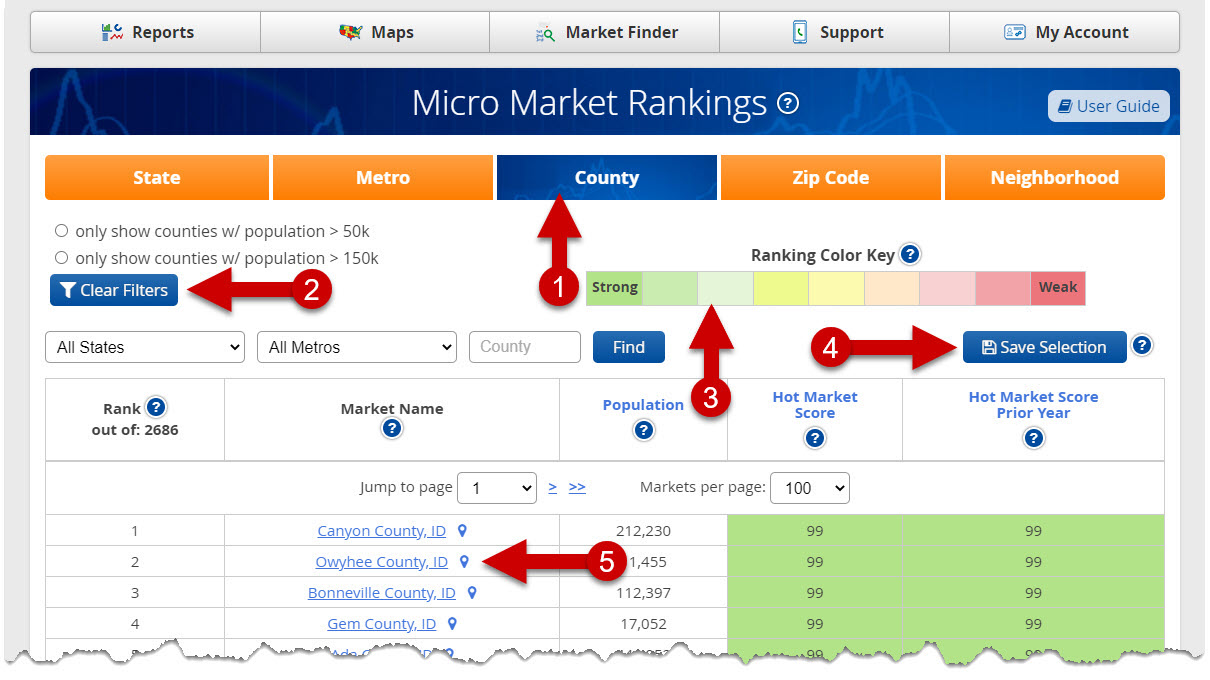
- You can search markets from the State to the Neighborhood level (click one of the orange buttons to make your selection).
- Filter your search by population size.
- The Ranking Color Key shows strong markets are shaded in green, and weak markets are shaded in red.
- Click the blue "Save Selection" button to save your specific search results to the "My Market Tracker".
- Click any market to view its appreciation on the Micro Maps.
Using Zip Code Ranking
The page loads displaying the score and ranking for ALL zip codes in ALL the Cities and States within your subscription. We track and analyze all zips codes that had enough home sale transactions in a year to produce valid results.
The screenshot below shows you how to search for the hottest zip codes within your subscription or based on specific search criteria (state, city, etc.)
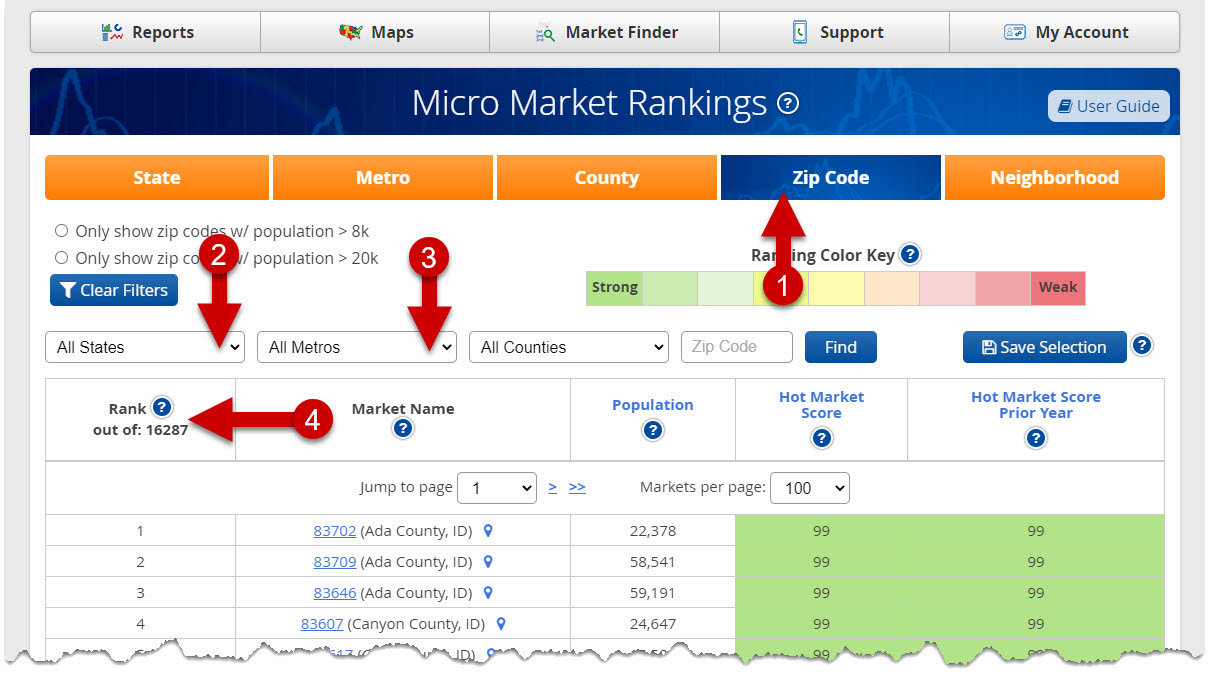
- Click the orange Zip Code button. It will turn blue once selected.
- Click the drop down arrow in the "All States" box to select the state you want to search.
- Click the drop down arrow in the "All Metros" box to select the state you want to search.
- This number tells you how many markets are being ranked based on your selections.
- You will see zip code 83617 was ranked as #1 at the time this article was produced. Clicking the zip code will take you Micro Maps to view the appreciation % for any zip code.
Note: ANY zip code with a score above 90 % is a ‘top' micro market. (Don't think in terms of there being only one or a few ‘best' micro markets.)
Any market with GREEN shading is a relatively strong market when compared to the entire U.S. The darkest green shading is reserved for the top 9% and includes over 1,500 individual zip codes!
In fact, you should NOT use these micro market tools as a stand-alone indicator. You should first determine the best CITY-level market and only THEN drill down to find the best sub-markets or ‘pockets' within that city to target your mailers, marketing and acquisition campaigns.
Micro markets are not markets unto themselves. They're sub-markets that tend to follow what's happening at the CITY or metropolitan level in the sense of: "a rising tide lifts all boats."
Of course there are stronger pockets WITHIN a metro area you should focus on, and weaker pockets you should avoid. That's exactly what these micro market tools are designed to help you do, in a few clicks.
Here's the general location MAP VIEW when you click on any market listed.
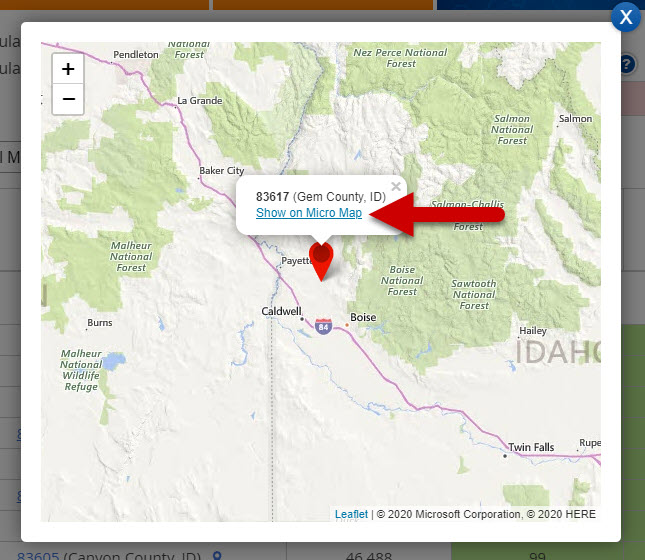
Below is the full color coded micro map for zip code 83617 in Idaho. This is shown when you click "Show on Micro Map" above. Note this will default to the "Annual Home Price Appreciation (%) - 2 yr. CAGR".
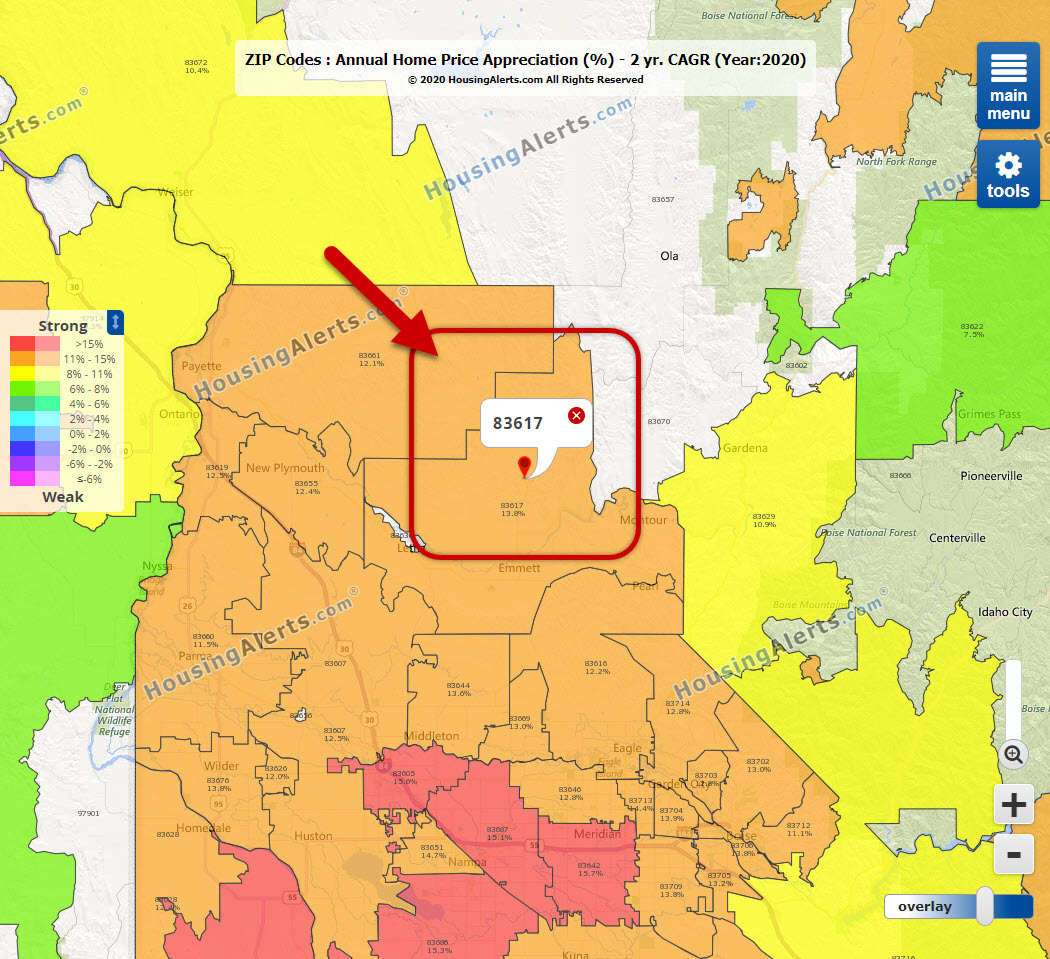
Note how this market is appreciating between 11% - 15% based on the 2 yr CAGR data. You can also see how this Zip is surrounded by several "hot" zip codes (in yellow and orange). This is a prime example of why it's critical to pick your sub-markets carefully!
The next step would be to look INSIDE zip code (and the neighboring hot zip codes you see here on the map) to find the hottest NEIGHBORHOODS.
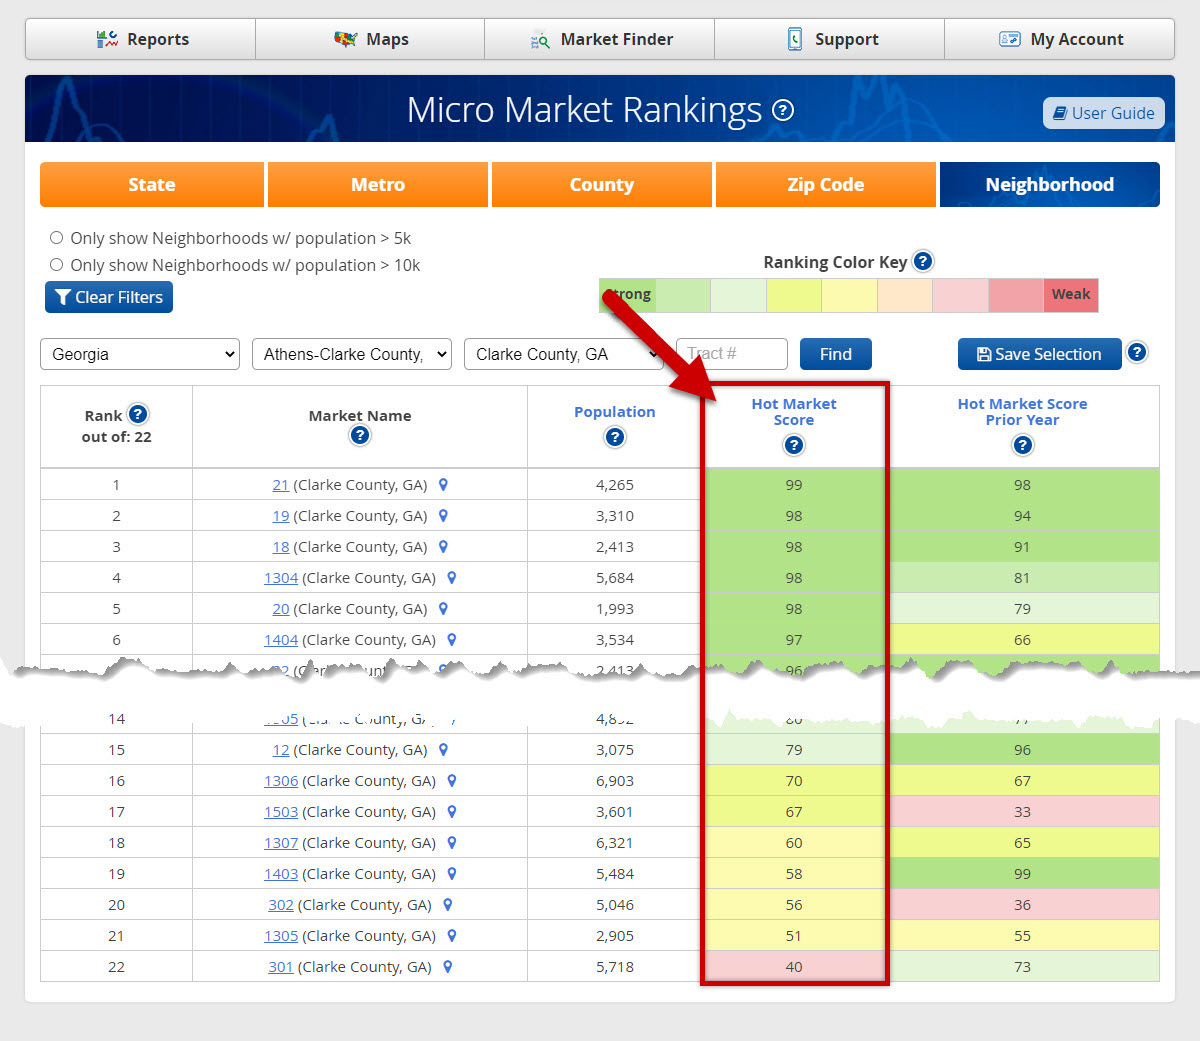
You can see from the NEIGHBORHOOD tool above, there are both very strong neighborhoods in zip code (dark green shading, scoring 99% of all U.S. neighborhoods) and some weak areas (yellow and red shading, scoring in the bottom 25% nationwide).
There is NOTHING that could have as big of an impact on your success than knowing WHERE to focus your time, money and effort.
When it comes time to flip the contract or sell the property, having property in a high-demand neighborhood practically sells itself compared to the same property in a flat or declining market that no one wants.
And, if you do any kind of prospecting or direct marketing for leads, knowing what neighborhoods or zip codes to target, or avoid, is worth 100x the monthly or annual membership in saved time and CASH expense!
Now can you see the power of being able to GEO-TARGET all of your acquisition efforts?