What is the Difference between Short term - Intermediate - Long Term STAR Momentum Indicators
Absent a major shift in Market Psychology, local real estate markets tend to maintain a steady trend in one direction. The trend can be up, down or flat. We call this 'market momentum.'
Technical Analysis, and in particular our S.T.A.R. tool, tracks and measures the strength of this momentum. We look at six different momentum markers and divide them into three groups:
- Short Term
- Intermediate
- Long Term
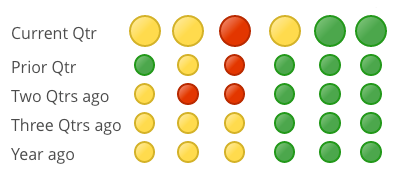
Similar to a traffic signal, these S.T.A.R. icons can be red, yellow or green.
Red is a bearish indicator, signaling negative or declining momentum.
Green is a bullish sign and indicates positive or upward, appreciating momentum.
Yellow means that indicator changed direction in that time period. If the new direction holds through the next period it will become green or red. If that indicator remains yellow for more than one consecutive time-period, it means that indicator is alternating between up and down.
The SHORT TERM indicators are very sensitive to small changes in momentum and typically change colors more often than intermediate and long term indicators. Some of that change (from red to yellow to green or vice-versa) may be due to normal and MINOR ups and downs in any local market.
For most real estate investing strategies, changes in the short term S.T.A.R. icons are not, by themselves, a cause for alarm except in these two cases:
1) Changes in the LONG TERM indicators are normally PRECEDED by changes in the short and intermediate tern indicators. All Trend Reversals (up or down) BEGIN with the short term triggers. So in that sense, the short term icons can provide very early warning signals that a change in the local cycle may be forthcoming.
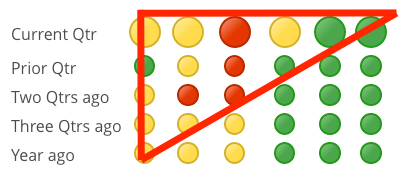
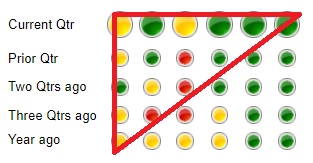
2) When the short and intermediate icons develop a consistent 'triangle' pattern of changing colors (from green to red, or red to green) ‘growing’ from left to right, it's usually a sign that a major change or reversal in market cycle could be underway.
Please watch this video for more details: https://www.housingalerts.com/training/#taps-star-tutorial
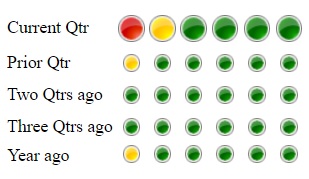
The LONG TERM indicators are slower to change colors and carry more significance when they do. They reflect a culmination of many data points over an extended time period and are less likely to be affected by normal market fluctuations.
Markets that do not display a consistent one-color pattern; with seemingly random color changes in several icons for the same period (i.e. - horizontally ) from one period to the next, especially in the long-term triggers, are generally lacking ANY momentum, and are poor investment markets for Leveraged Appreciation..
It is important to note that strong upward momentum, by itself, does not necessarily signal a strong, investable market. Having strong, positive momentum is the first step when deciding to enter a market but must be confirmed by strong TAPS scores and Wealth Phase charts.
However, a market that lacks positive, upward momentum (for ex, has a lot of red icons in the intermediate and long term columns for the current period) is NOT a good candidate for new investment.