TAPS Indicators – the Basics
The TAPS (Technical Analysis Point Score) indicator is an easy to understand, graphical way to show the results of complex Technical Analysis (TA) ‘
Studies.’
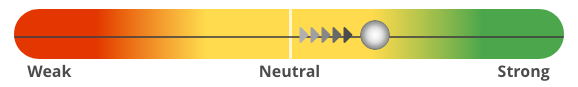
The simple ‘
slider ball’ can move a total of five notches starting from far left (Weak) to far right (Strong).
If the ball position has moved since the prior period, it will have a series of arrows behind it. If the arrows are on the left, that signifies a move from the left, from a weaker to a stronger position, and vice-versa.
Each detailed TA Study has its own slider ball indicator and consists of dozens to hundreds of individual calculations (collectively referred to as ‘algorithms’).
These detailed algorithms are aggregated and weighted to produce higher level Summary slider indicators until the top-level, overall score is attained.
These proprietary TAPS scores are then ranked and compared to other markets to optimize the member’s opportunity cost and investment success.
Using complex, proprietary and back-tested calculations these TAPS scores are then merged into the Momentum (STAR) Studies to produce the most reliable, state-of-the-art and proven local real estate market cycle system on the planet!
Please visit the free
Video Training section for more in-depth education.
Housing Alerts Lite & PRO
[ Joined After January 2018 ]
Housing Alerts Legacy (Classic)
[ Joined Before January 2018 ]